If you are new to either remote sensing, biodiversity or conservation but are interested to combine these topics, this page might help you:
Why use Remote Sensing?
Remote Sensing has as many other approaches various pros and cons but especially for Biodiversity and Conservation it offers the advantage to provide
- broad scale
- multi scale
- repeatable
- objective
- timely (and historical)
- and affordable environmental data
which provides information about any remote area on the Earth to analyse changes and its causes over time.
Remote Sensing for Biodiversity Research?
Depending on the type of Biodiversity and the specific species used remote sensing does provide the corresponding environmental information as well as the history of the landscape which can be used to explain the biodiversity patterns as well as the abundance or composition. Any sampled Biodiversity data has a spatial dimension and hence can be linked to the correponding location in any satellite image.
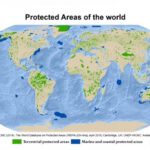
Remote Sensing for Conservation application?
Especially Conservation needs timely as well as historical information in order to monitor protected areas or define new areas for conservation priorities. Using data sets with a high temporal repetition rate does allow to monitor conservation efforts and conduct an accurate broad scale evaluation. Moreover can remote sensing help to map all settlements, agriculture fields or roads in order to anticipate human-wildlife conflicts.
Advantages to use Biodiversity and Conservation data in Remote Sensing?
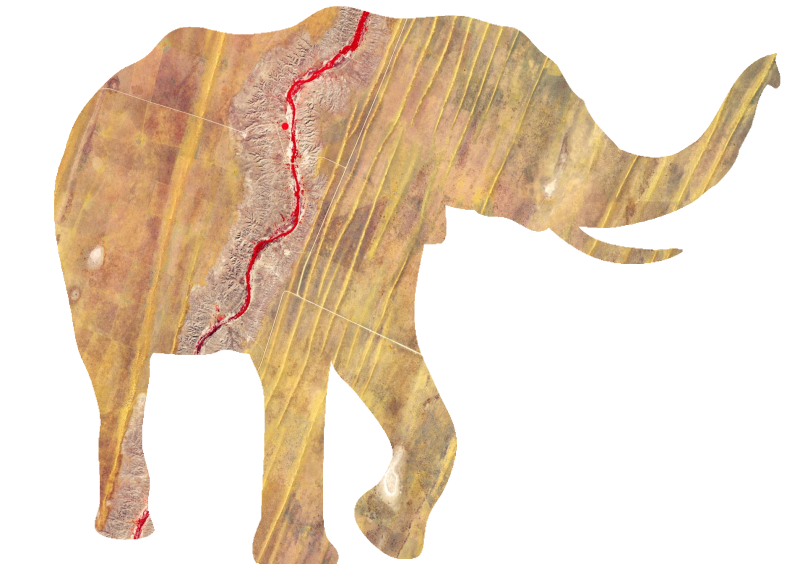
The usage of Remote Sensing for Biodiversity or Conservation is highly relevant but Remote Sensing can also benefit from Biodiversity and Conservation data. Biodiversity and Conservation project harbour a huge amount of species distribution, abundance or landscape data like location of plantations, logging events inside national parks, elefant ranges etc.. Using such in-situ data can help to improve e.g. remotely sensed landcover classifications or beeing used for plausibility analysis of many data sets.
Future Perspectives
Future new satellite launches will of course supply the Biodiversity and Conservation community with exciting new opportunities, however in the long term a stronger link between all communities is needed in order to discuss and develop on a daily basis ecological adequate parameter rather using the other community as data provider only.
Remote Sensing data is information about the spectral reflectance or emittance of an object. Not unlike our human visual perception it is recorded by a sensor onboard a satellite or aircraft. The spectral information provided differs depending on the sensor and is characterised by its resolution.
A good interactive tool set which helps you to get into remote sensing can be found at BiodiversityInformatics.
Different types of Resolution
In remote sensing different types of resolution exist, which are relevant for Biodiversity and Conservation application:
- spatial resolution (interactive example)
- temporal resolution
- spectral resolution (interactive example)
- thematic resolution
Moreover all data sets differ in their coverage or extent of area which is covered by one scene (interactive example). Downloadable images of remote sensing data sets are called scenes and split based on different systems (e.g. the path and row system for Landsat WRS2 or the h and v tiles system by MODIS). If you mosaic these scenes you cover a larger area.
Spatial Resolution
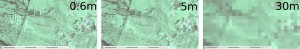 Spatial Resolution the size of the pixel inside an image. Pixel hold information (a whole oder decimal point number) which provides information about the reflectance or an index e.g. a vegetation index like the NDVI. The spatial resolution of a satellite image depends on the sensor. Some very high resolution data sets by Quickbird, WorldView-2 etc. do provide a spatial resolution up to half a meter (see left image below). Others like RapidEye have a spatial resolution of 5-6.5m and the most abundant (from a historical point of view) spatial resolution is 30m (right image) which is available in Landsat imagery. While the spatial accuracy is decreasing, does the extent of the imagery increase.
Spectral Resolution
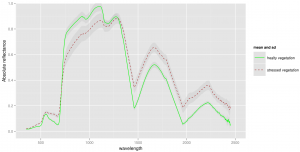 Each object has a distinct spectral signature which can be measured using a handheld spectrometer and results in a different signal for each type (see figure). The spectral resolution of remote sensing data refers to the width and related to that the amount of bands covering different spectral ranges. Landsat for example provides 7 bands (+ 1 panchromatic) which are covering different spectral areas. Hyperspectral data contains more than hundred bands (depending on the sensor) which very narrow spectral coverage, hence it is able to differentiate between subtle spectral differences.
more information concerning thematic and temporal resolution are available in several textbooks such as “Remote Sensing and GIS for Ecologists“.
Projections
Considering the right projection for your study site and work is crucial. UTM WGS 84 is quite common for small scale analysis, while lat long or Albers Equal Area are better suited for global or continental analysis.
An overview how the view of our planet changes with different settings can be experienced here: