Global datasets from the Nature publication by Coops et al. are available for download – from their webpage:
-
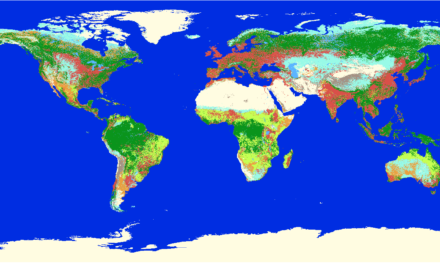
The datasets are the final outputs of two-stage clustering using inputs of global Dynamic Habitat Index (DHI) variables of annually integrated cumulative, minimum and variation of fPAR (fraction of photosynthetically active radiation) and latitude (degrees from equator):
-
DHI_global_clusters_14c_sv20.dat is a 14-cluster output, developed for direct comparison with the 14 global biomes produced in 2001 by Olson et al. (https://www.worldwildlife.org/publications/terrestrial-ecoregions-of-the-world). Colors were assigned relative to average DHI variables for each cluster, such that green clusters indicate relatively higher productivity and lower seasonality (e.g., rainforests), blue areas indicate higher seasonality and lower productivity (e.g., boreal forests), and red areas indicate low productivity and low seasonality (e.g., deserts).
download and read more here:
DHIs clusters