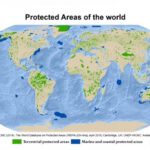
Explaining animal movement patterns using remotely sensed environmental information and vice versa is increasingly possible with new remote sensing data sets and improved animal tracking technologies. A great visualization of this has been done within AniMove using the moveVis R package on vultures. The Turkey Vulture (Cathartes aura) is the most widespread scavenging bird on the american continents, ranging from southern Canada to the tip of South America. Since 2003, the Hawk Mountain Sanctuary is collecting movement data of Turkey Vultures to investigate their migration behaviours, using radio tags monitored by satellite. 21 Turkey Vultures have been tracked during that period of time. The dataset is available on Movebank (Movebank ID: 481458). To learn more about the Turkey Vulture in general, read a detailed overview of the species here at the Hawk Mountain Sanctuary website.
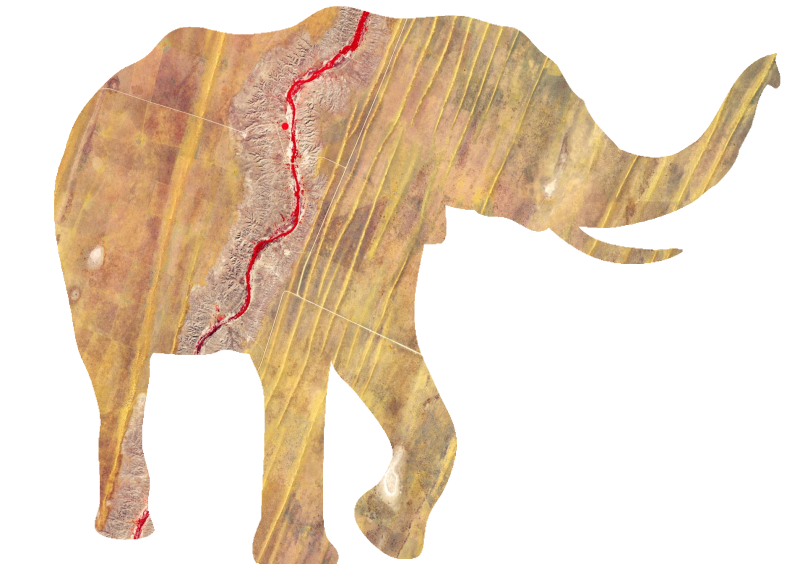
The shown video animation visualizes the southbound migration paths of 10 individuals, moving from southern California, U.S., towards Mexico in 2014, against the Normalized Difference Vegetation Index (NDVI) derived from MODIS data (dynamic, temporal resolution of 1 day, computed from fusing daily and interpolated 16-days NDVI products). Besides displaying the spatial movement, the graphs on the right give information on the map values overflown by each bird and the overall population, compared to the value distribution of the image.
For animating both movement and environmental data, the animate_move function of the moveVis R package was used, which is capable of visualizing movement tracks of multiple individuals in front of either a static base map or a dynamically changing set of user-defined layers, e. g. representing an environmental variable. In addition, the function offers several path modes, which define the treatment of time information, options for adding static elements such as annotated points, lines or polygons to the animation and more.
moveVis is an R package for displaying animal (or other kinds of) movement as video animations. The movement paths can be overlayed on dynamic or static environmental data to visualize interactions between individuals and possible influences of environmental variables on movement behaviours. To install moveVis in R, simply use the command install_packages(‚moveVis‘). For more information on moveVis, further example animations and a guide for getting started, visit www.movevis.org.
Visit the twitter profile of Hawk Mountain Sanctuary (https://twitter.com/Hawk_Mountain). To stay informed about new moveVis functionalities and updates, go to http://www.twitter.com/schwalbwillmann.
The data have been used with permission by D. Barber. Times are UTC. Post from www.animove.org (science school on animal movement and remote sensing combination)